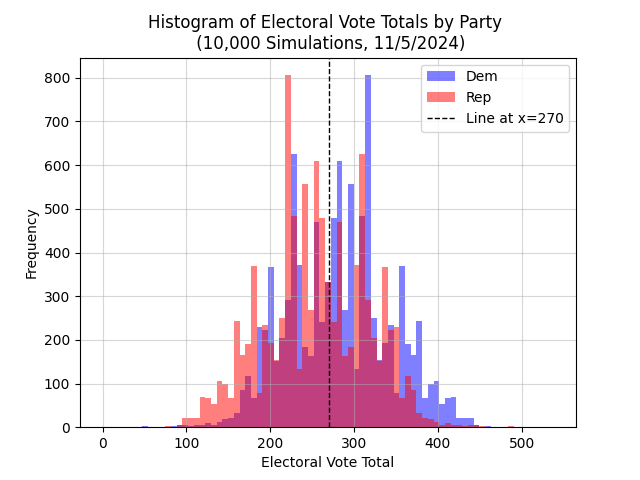
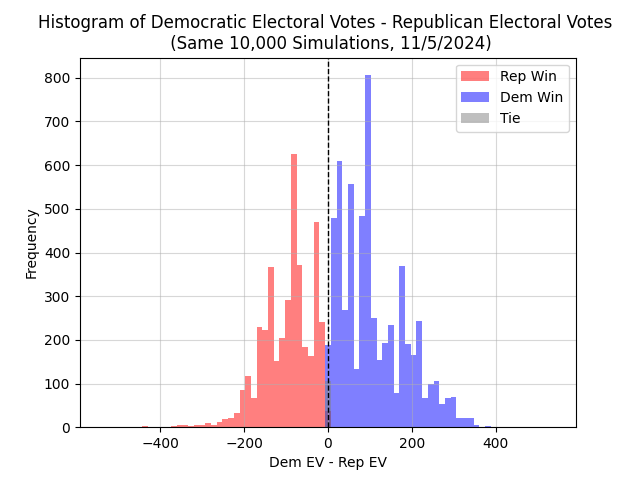
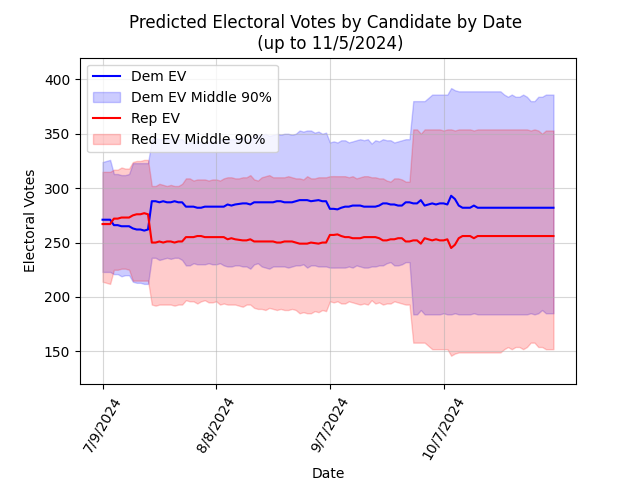
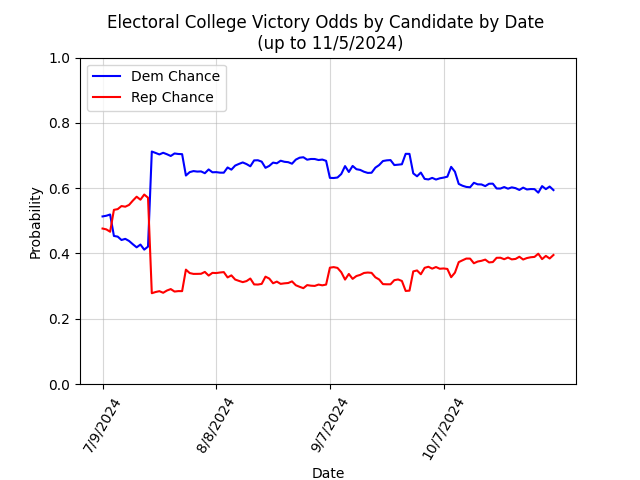
Upon learning about Joe Biden dropping out of the race, the Democratic candidate was changed to Kamala Harris.
However, there is not yet enough polling to calculate reliable odds for the election with Harris as the Democratic nominee.
Despite this, the model will keep updating daily as more information gradually comes in. This popup will disappear once there is substantial enough polling for Harris in swing states to calculate a more realistic probability.


Analytica Dataworks uses the Popular Vote Proportion (PVP) model, an in-house projection system that utilizes polling data by jurisdiction to predict popular vote percentages for the three major candidates. For polls ahead of the 2020 election, machine learning was used to find the factors that best predict polling error. The resulting weights are then applied to 2024 polls, and the ones with the lowest expected error are weighed more heavily in predicting vote proportions. A critical mass of polls is necessary for this process to work, so not all states appear under the drop down menu above due to sample size constraints.
For states where polling sample size is not great enough, the winner of the 2024 election in the electoral summary is projected based on a weighted average of the state's election results from 2004 through 2020. This assumption works well enough since states without substantial polling are typically much less competitive and the winner is much easier to project (e.g. California for Democrats and Wyoming for Republicans). Note that for the purposes of this model, Washington D.C. is considered its own state, while other individual districts that may vote separately from their states (e.g. Nebraska's 2nd congressional district and Maine's 2nd as well) are not considered separate from their parent states.
This page updates automatically once per day at 8:00 AM Eastern time. However, note that data may not appear to change over small time intervals as a large volume of polls is used to make these calculations.
poll_avg: The polling average we calculate for a given candidate in this jurisdiction.
pct_pred: The percentage of the popular vote we estimate a given candidate will get in this jurisdiction.
wpct: The percent chance of winning a given candidate has in this jurisdiction among a sample of 10000 simulated elections.
ev_mean: The mean number of electoral votes a given candidate wins in the sample of 10000 simulated elections.
ev_stdev: The standard deviation of electoral votes a given candidate wins in the sample of 10000 simulated elections.
ev_p5: The 5th percentile of electoral votes for each candidate. We estimate a 5% chance a given candidate gets this number of electoral votes or fewer.
ev_p25: The 25th percentile of electoral votes for each candidate. We estimate a 25% chance a given candidate gets this number of electoral votes or fewer.
ev_p50: The 50th percentile of electoral votes for each candidate. We estimate a 50% chance a given candidate gets this number of electoral votes or fewer.
ev_p75: The 75th percentile of electoral votes for each candidate. We estimate a 75% chance a given candidate gets this number of electoral votes or fewer.
ev_p95: The 95th percentile of electoral votes for each candidate. We estimate a 95% chance a given candidate gets this number of electoral votes or fewer.
wpct: The Electoral College winning percentage for each candidate based on 10000 simulations.
Polling data is graciously sourced from FiveThirtyEight.com. You can find their CSV file of polls to download at the bottom of this page. Election voting data from 2004 through 2020 is sourced from the MIT Election Data and Science Lab published on the Harvard Dataverse.